BNAN 277 · Business analytics
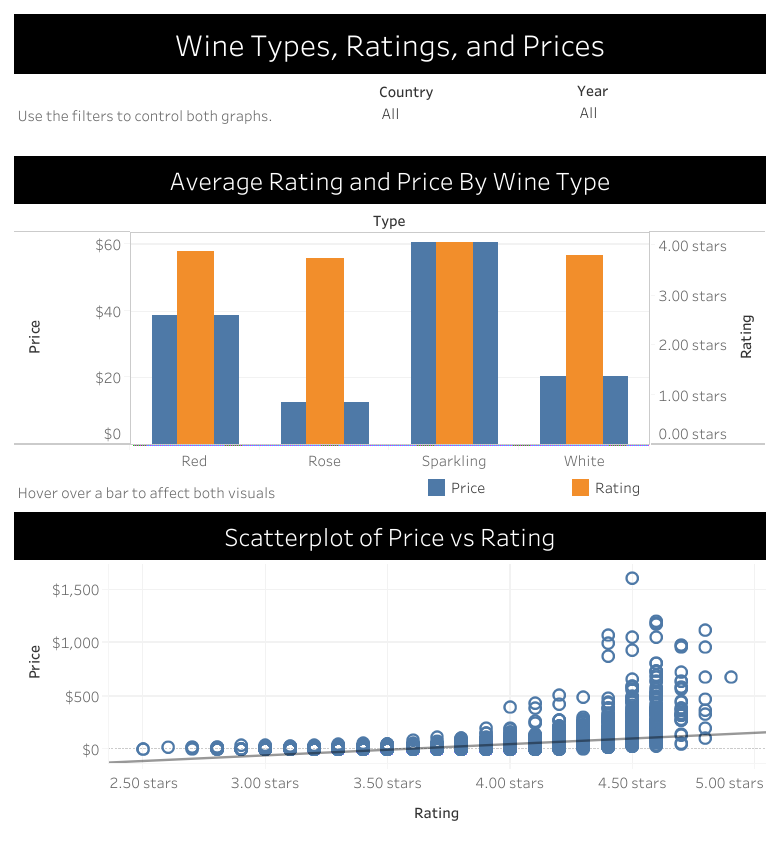
Wine Types, Ratings, and Prices
I built this Tableau dashboard for a business analytics assignment exploring wine prices and ratings.
The filters and charts make it easier to compare wine types and explore the data. It shows how I turn information into something a business audience can use and understand.
Commercial real estate decisions run on data. This supports my core values: the ambition is there, and so is the care to make the work clear and usable.